Larry, those are good points and you're correct.
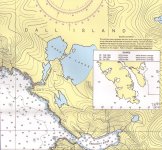
As to the data validity, if the survey isn't good, well, garbage in equals garbage out. We used a C-Map cartridge for the North Channel in Lake Huron, which is a pretty remote place. I checked various small features on the chart (using the boat's GPS position) versus reality, and I believe it was within 10 ft. I don't know how C-Map does that but I was impressed. Note that C-Map is not government data, but their own charting data. I'd love to know how they do that, since I believe they/everybody starts with government surveys. So the conclusion is that some charts are better than others.
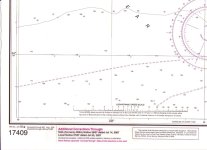
As to the width of a line on a chart, that's independent of the data validity. And with a raster chart, that width scale never changes. With a ENC chart, the width of the line stays the same as you zoom in, so the apparent width decreases. And as there is more room on the ENC chart, more text and icons can be displayed for more information. As you zoom in on a raster chart, the data becomes more pixillated.
To be honest, I use raster charts, actually printed charts, when I want overall area configuration. When I'm navigating, I appreciate the vector charts in C-Map.
What I really want now is the NOBELTEC radar that plugs into a PC. For less that $2500, I'd have a 15" screen, navigation software, and a PC for non navigation tasks. Does anybody have this setup? Can one of those ATOM processor notebooks run navigation software?
Both Nobeltec (VNS MAX Pro Navigation Software) and C-Map are now owned by Jeppson, so my chips should be useable. It's a long term project, selling Judy, mounting the PC and getting the software. Anyway it's a thought.
Boris


